Use the established LOPA method
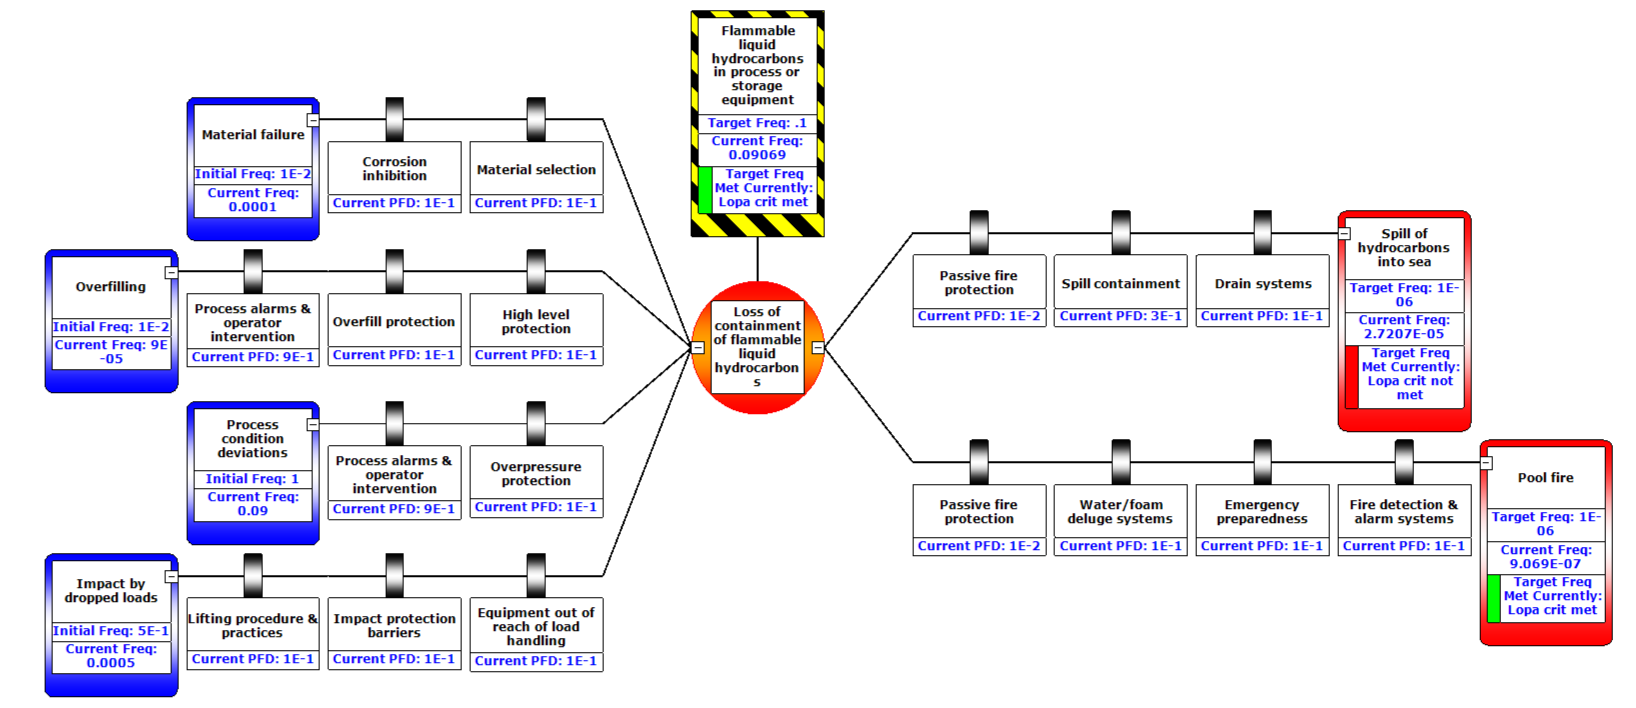
While traditional LOPA calculations focus on one single scenario, the LOPA feature in BowTieXP Complete takes all scenarios into account while calculating the top event frequency.

While traditional LOPA calculations focus on one single scenario, the LOPA feature in BowTieXP Complete takes all scenarios into account while calculating the top event frequency.

Use a Microsoft Excel compatible spreadsheet to create your own methods for quantified and visual risk assessment in BowTieXP Complete.
Layers of Protection Analysis (LOPA) is a semi-quantitative risk analysis in which the frequency of a negative event is calculated according to the risk reduction by the Independent Protection Layers (IPLs). In bowtie-based LOPA, you calculate the frequency of a consequence, given the threats and IPLs in play. The LOPA feature allows you to fill in the initial frequencies of the threats and the Probability of Failure on Demand (PFD) for the barriers. You can also add target frequencies for the consequences and the top event. The software automatically calculates the relevant numbers, like the consequence frequency, and displays them on the bowtie diagram if desired.
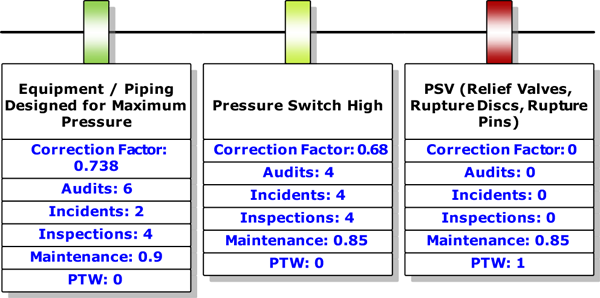
BowTieXL introduces a Microsoft Excel compatible spreadsheet into BowTieXP, which exposes all the information in the case file as tabular data in this spreadsheet. This allows you to use that data to do spreadsheet calculations, based on that data, and feed the results back into your bow-tie model. It also allows you to define extra variables on the bow-tie diagram itself for use in calculations. This functionality gives you a lot of freedom to create what you need. You can for instance calculate average effectiveness of controls, use the effectiveness score to color controls, create a financial model that lets you know what the cost reduction is for each control that you add or make a questionnaire that feeds back into your bowtie. Calculating aggregated effectiveness of barriers One of the most popular uses of the spreadsheet function is the ability to calculate the aggregated effectiveness of controls. Previously there was no real way to combine the effectiveness of multiple barriers. Now, the Excel functionality makes it possible to aggregate values across multiple barriers to ascertain the overall effectiveness. The applications for such calculations are far reaching, for instance in determining your ALARP level.
 We're just an email away
Feel free to contact us with any questions you might have. Our enthusiastic support team is here to help you choose the solution best suited to your needs.
Email us (Click here) or visit the Support section on our website.