Use the power of Excel
Take your bowties to the next level with existing data. Introduce new data values and a wide range of formulas to your bowtie.

Take your bowties to the next level with existing data. Introduce new data values and a wide range of formulas to your bowtie.
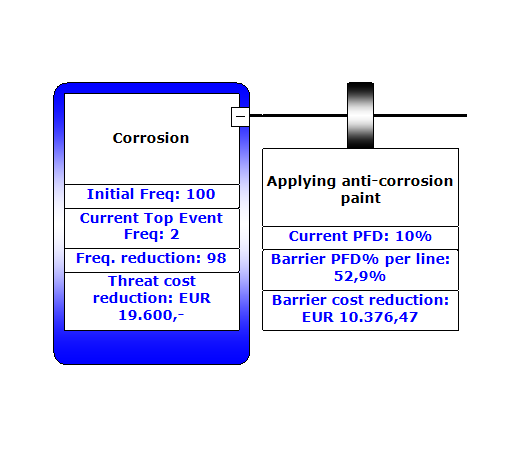
Improve risk based decision making with cost-benefit analyses, ALARP calculations or barrier criticality calculations.
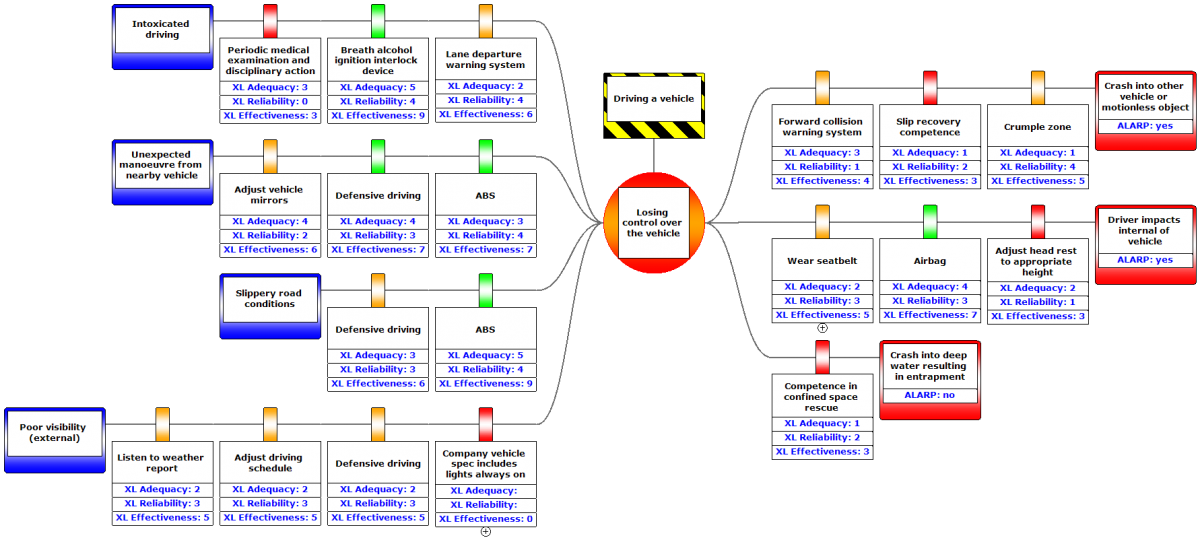
Quantify your bowties. Visualize your customized calculations in one barrier based risk picture: the bowtie diagram.
What is Spreadsheet feature?
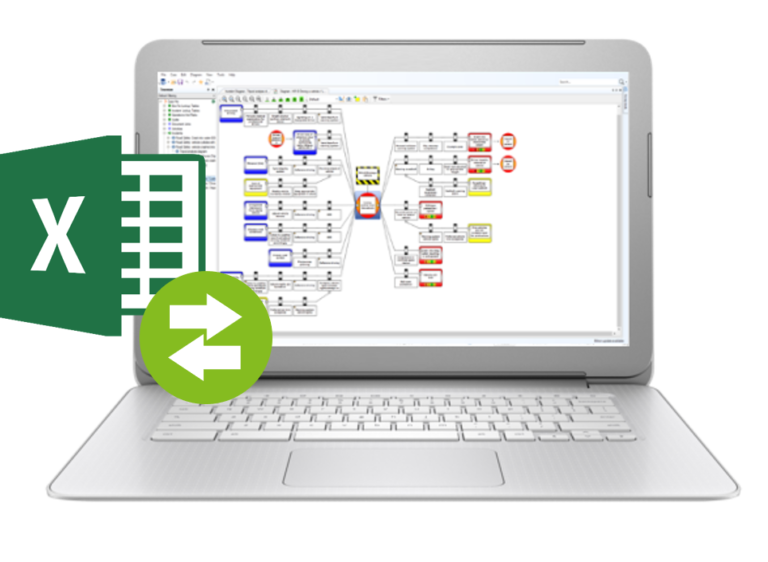
The Spreadsheet feature in BowTieXP Complete allows you to create your own methods for quantified and visual risk assessment in BowTieXP.
The application introduces a Microsoft Excel compatible spreadsheet into BowTieXP, which exposes all the information in the case file as tabular data in this spreadsheet. This allows you to use that data to do spreadsheet calculations based on that data, and feed the results back into your bowtie model.
It also allows you to define extra variables on the bow-tie diagram itself for use in calculations. This functionality gives you a lot of freedom to create what you need. You can for instance calculate average effectiveness of controls, use the effectiveness score to color controls, create a financial model that lets you know what the cost reduction is for each control that you add or make a questionnaire that feeds back into your bowtie.
Quantify your bowties
Create your own risk analysis methods by using BowTieXL. Build and manipulate data in bowtie diagrams by making use of Microsoft Excel functionality. This software connection allows for freedom and flexibility, finding various ways to quantify bowties. Create actual risk pictures by using self-conceived formulas.
Customize calculations using Excel functionality to add value to your data. Build a more dynamic picture by combining multiple data resources and aggregating the results. Barrier effectiveness values can for example be calculated and linked to consequences to help determine an organization’s ALARP level.
Improve risk assessments
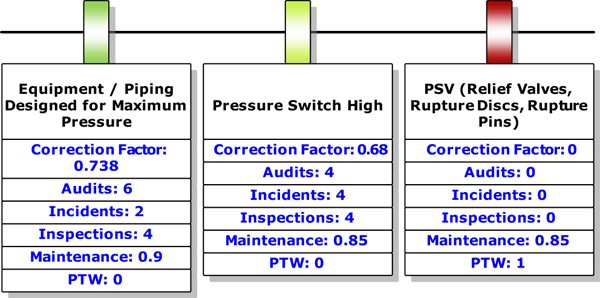
Improve your risk based decisions by combining both qualitative and quantitative risk assessments, all visualized in one clear bowtie picture. Enable multiple ways to carry out Process Safety calculations for your Safety Integrity level (SIL), Safety Instrumented Function (SIF), Failure Mode and Reliability Analysis (FMRA), and so on.
 Courses & events
Looking for an opportunity to discuss the Spreadsheet feature? Have a look at one of the scheduled events below or check the complete event calendar. If you can’t find a course of your interest, don’t hesitate to contact us via [email protected] or +31 (0) 70 362 6126 so we can help you find a suitable alternative.
 Blog posts on this subject
Want to know more about the Spreadsheet feature or quantification? We regularly write blog posts about this subject.
 We're just an email away
Feel free to contact us with any questions you might have. Our enthusiastic support team is here to help you choose the solution best suited to your needs.
Email us (Click here) or visit the Support section on our website.